
サーバ監視・リソース情報などの収集(Prometheus)・可視化ツール(Grafana)として、最近よく見るため実際に動かしてみました。
ここではSpring-bootフレームワークを使ってメトリクスデータを収集することとし、まずは下記を参考にサンプルのJava Webアプリを作成しました。
https://spring.pleiades.io/spring-boot/docs/current/reference/html/getting-started.html#getting-started.first-application
環境) Ubuntu 22.04 (192.168.1.172)
n@n10:~/spring/work01$ cat ~/.bash_profile
export JAVA_HOME=$(readlink -f /usr/bin/java | sed “s:bin/java::”)
export PATH=$PATH:/opt/apache-maven/bin
n@n10:~/spring/work01$ java -version
openjdk version “17.0.6” 2023-01-17
OpenJDK Runtime Environment (build 17.0.6+10-Ubuntu-0ubuntu122.04)
OpenJDK 64-Bit Server VM (build 17.0.6+10-Ubuntu-0ubuntu122.04, mixed mode, sharing)
n@n10:~/spring/work01$ mvn -v
Apache Maven 3.9.0 (9b58d2bad23a66be161c4664ef21ce219c2c8584)
Maven home: /opt/apache-maven
Java version: 17.0.6, vendor: Private Build, runtime: /usr/lib/jvm/java-17-openjdk-amd64
Default locale: en_US, platform encoding: UTF-8
OS name: “linux”, version: “5.15.0-67-generic”, arch: “amd64”, family: “unix”
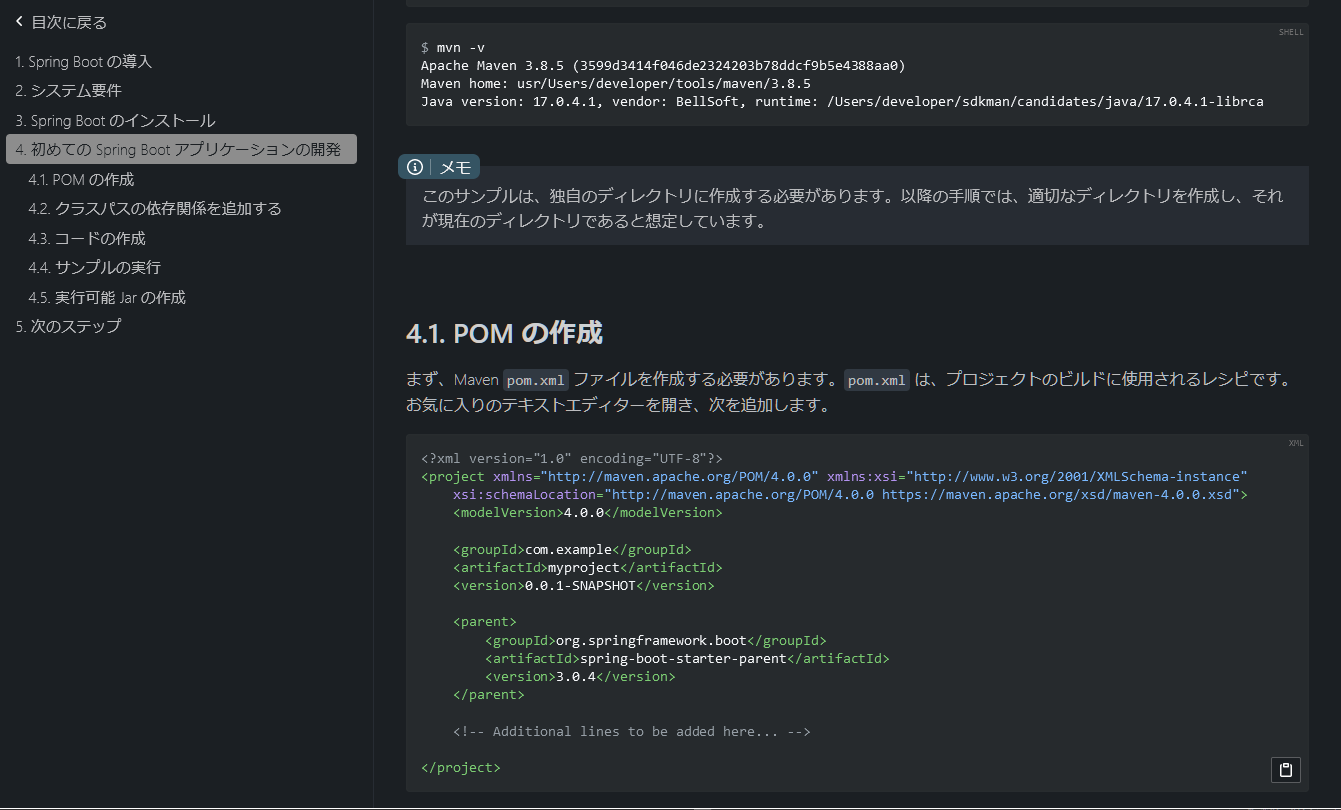
mavenとかpomとか、いつも開発の初めに戸惑いますので、手順を残しておきます。(mavenのインストールは下記参照)
https://decode.red/net/archives/1424
spring.pleiades.ioのサイトにあるpom.xmlをベースに、Webアプリを構築するためのスタータ、メトリクスを収集するためのアクチュエータ、Prometheusとの連携するためのライブラリ、そしてjarにビルドするための設定を追加しました。(pom.xmlをエディタで作成してから、同フォルダでmvnコマンド実行)
pom.xml
|
1 2 3 4 5 6 7 8 9 10 11 12 13 14 15 16 17 18 19 20 21 22 23 24 25 26 27 28 29 30 31 32 33 34 35 36 37 38 39 40 41 42 43 |
<?xml version="1.0" encoding="UTF-8"?> <project xmlns="http://maven.apache.org/POM/4.0.0" xmlns:xsi="http://www.w3.org/2001/XMLSchema-instance" xsi:schemaLocation="http://maven.apache.org/POM/4.0.0 https://maven.apache.org/xsd/maven-4.0.0.xsd"> <modelVersion>4.0.0</modelVersion> <groupId>com.example</groupId> <artifactId>myproject</artifactId> <version>0.0.1-SNAPSHOT</version> <parent> <groupId>org.springframework.boot</groupId> <artifactId>spring-boot-starter-parent</artifactId> <version>3.0.4</version> </parent> <dependencies> <dependency> <groupId>org.springframework.boot</groupId> <artifactId>spring-boot-starter-web</artifactId> </dependency> <dependency> <groupId>org.springframework.boot</groupId> <artifactId>spring-boot-starter-actuator</artifactId> </dependency> <dependency> <groupId>io.micrometer</groupId> <artifactId>micrometer-registry-prometheus</artifactId> </dependency> </dependencies> <build> <plugins> <plugin> <groupId>org.springframework.boot</groupId> <artifactId>spring-boot-maven-plugin</artifactId> <configuration> <mainClass>com.example.MyApplication</mainClass> </configuration> </plugin> </plugins> </build> </project> |
src/main/resources/application.properties
debug=true
management.endpoints.enabled-by-default=true
management.endpoints.web.exposure.include=*
src/main/java/MyApplication.java (メトリクスには無関係だが一応作成)
|
1 2 3 4 5 6 7 8 9 10 11 12 13 14 15 16 17 18 19 20 |
package com.example; import org.springframework.boot.*; import org.springframework.boot.autoconfigure.*; import org.springframework.web.bind.annotation.*; @RestController @SpringBootApplication public class MyApplication { @RequestMapping("/") String home() { return "Hello World!"; } public static void main(String[] args) { SpringApplication.run(MyApplication.class, args); } } |
依存性ツリーの表示
mvn dependency:tree
サンプルプログラム(192.168.1.172:8080)を実行するサーバの起動
mvn spring-boot:run
パッケージのビルド(一応確認)
mvn install (or mvn package)
パッケージから実行
java -jar target/myproject-0.0.1-SNAPSHOT.jar
Prometheusのインストール
参考)
https://www.server-world.info/query?os=Ubuntu_22.04&p=prometheus&f=1
https://www.server-world.info/query?os=Ubuntu_22.04&p=prometheus&f=5
sudo apt install prometheus prometheus-node-exporter
service prometheus status
/etc/prometheus/prometheus.yml にspring-bootへ接続する設定を追加
– job_name: ‘spring’
metrics_path: ‘/actuator/prometheus’
static_configs:
– targets: [‘localhost:8080’]
サービスstart確認して下記にアクセス
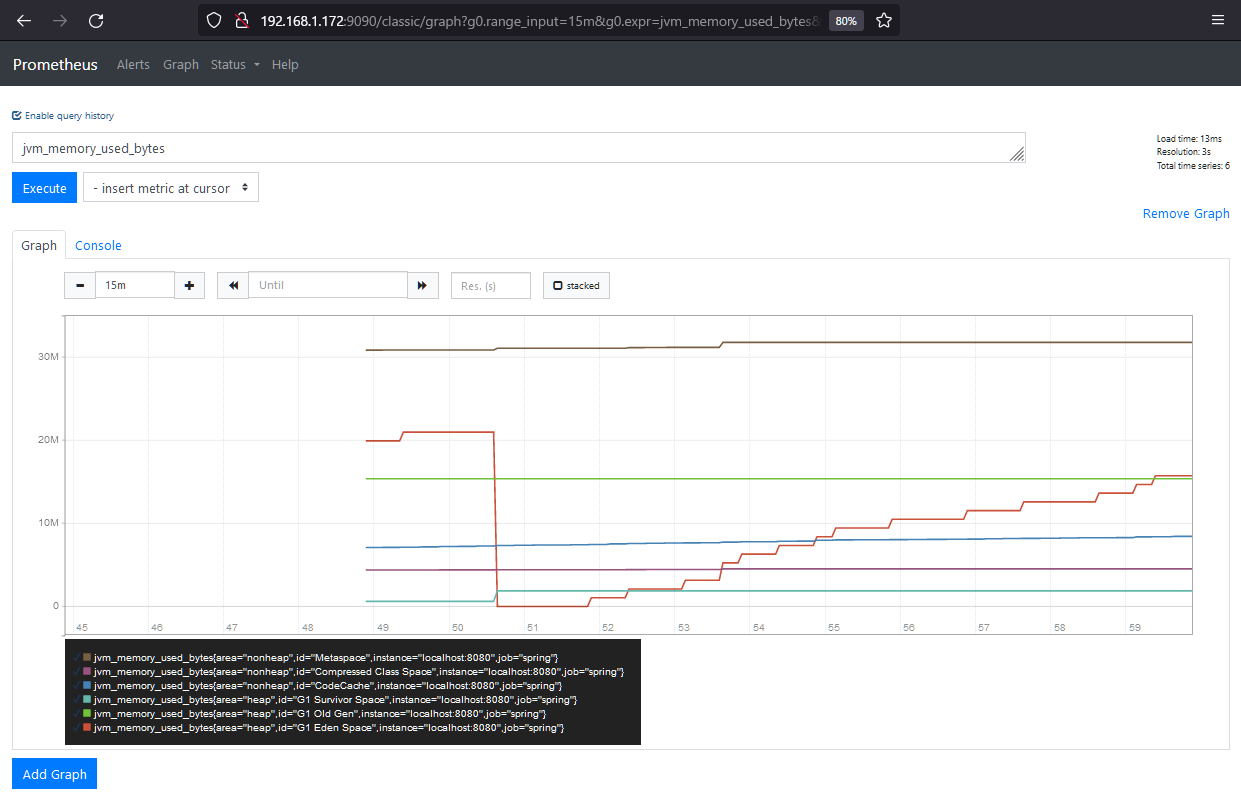
http://192.168.1.172:9090/classic/graph
Grafanaのインストール
参考)
https://www.server-world.info/query?os=Ubuntu_22.04&p=grafana
rootユーザで
wget -q -O /usr/share/keyrings/grafana.key https://packages.grafana.com/gpg.key
echo “deb [signed-by=/usr/share/keyrings/grafana.key] https://packages.grafana.com/oss/deb stable main” | tee -a /etc/apt/sources.list.d/grafana.list
apt update
apt install grafana
root@n10:~# service grafana-server status
○ grafana-server.service – Grafana instance
Loaded: loaded (/lib/systemd/system/grafana-server.service; disabled; vendor preset: enabled)
Active: inactive (dead)
Docs: http://docs.grafana.org
サービスstartとして下記にアクセス
http://192.168.1.172:3000/login
Prometheus画面
jvm_memory_used_bytesというメトリクスを選択
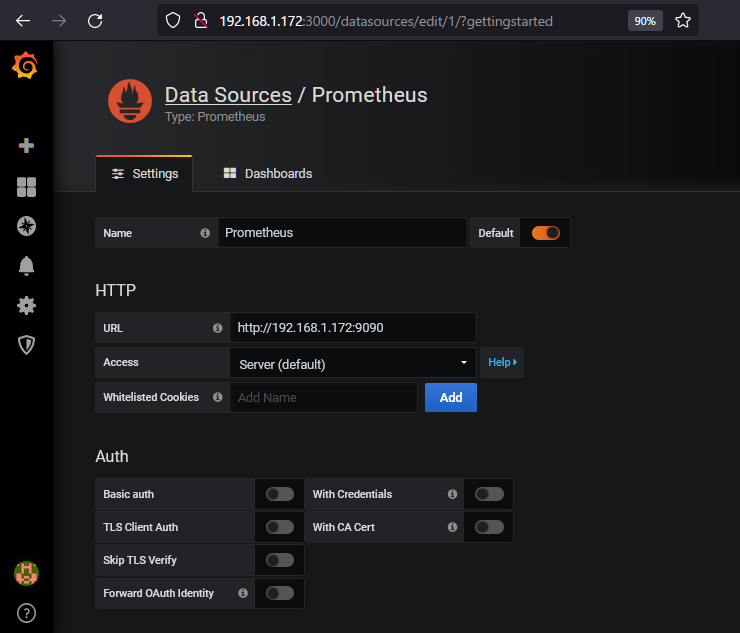
Grafana画面
prometheusとの接続
同様に、jvm_memory_used_bytesというメトリクスを選択
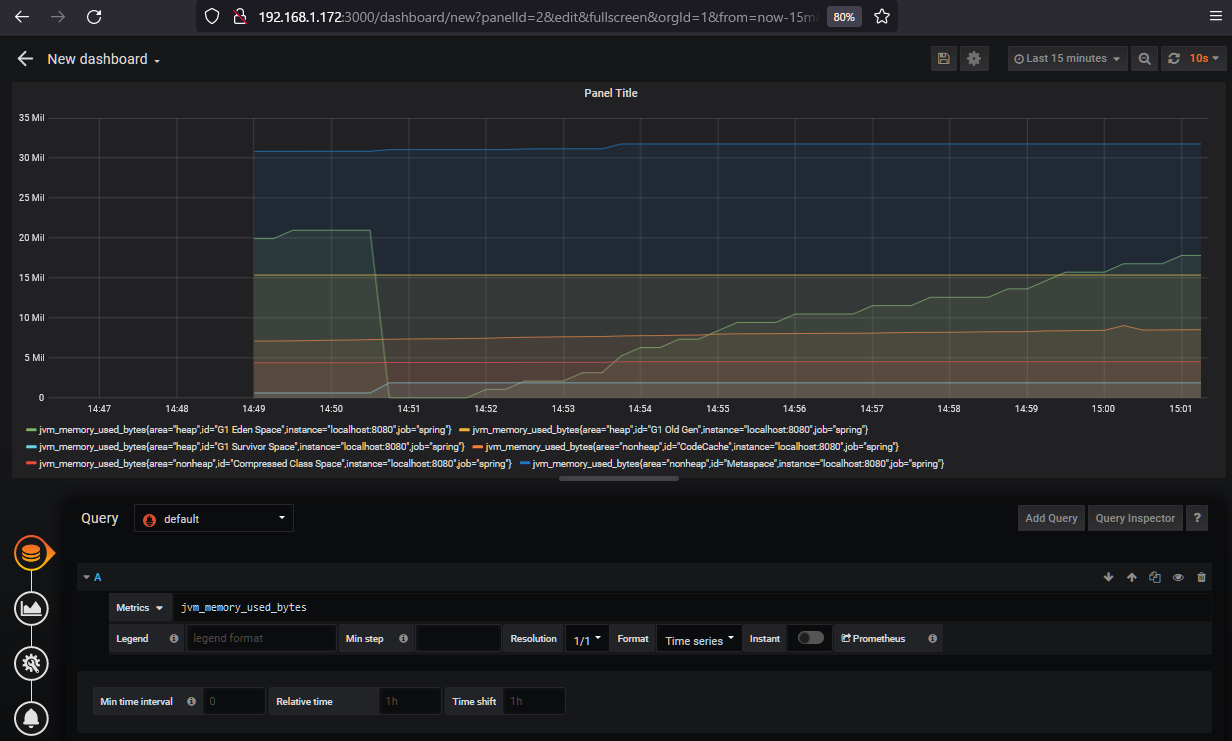
このようにJVMのメモリを簡単にモニタすることができました。
prometheus.ymlの設定で、spring-bootへの接続設定をしていなくても、JVM関連のメトリクスの選択項目自体は表示されますが、選択しても”no data”となります。
長くなりますが、最後にactuatorでどのようなものが出力されるのか、のこしてみました。
n@n10:~$ curl http://localhost:8080/actuator | jq
% Total % Received % Xferd Average Speed Time Time Time Current
Dload Upload Total Spent Left Speed
100 1844 0 1844 0 0 328k 0 –:–:– –:–:– –:–:– 360k
|
1 2 3 4 5 6 7 8 9 10 11 12 13 14 15 16 17 18 19 20 21 22 23 24 25 26 27 28 29 30 31 32 33 34 35 36 37 38 39 40 41 42 43 44 45 46 47 48 49 50 51 52 53 54 55 56 57 58 59 60 61 62 63 64 65 66 67 68 69 70 71 72 73 74 75 76 77 78 79 80 81 82 83 84 85 86 87 88 89 90 91 92 |
{ "_links": { "self": { "href": "http://localhost:8080/actuator", "templated": false }, "beans": { "href": "http://localhost:8080/actuator/beans", "templated": false }, "caches-cache": { "href": "http://localhost:8080/actuator/caches/{cache}", "templated": true }, "caches": { "href": "http://localhost:8080/actuator/caches", "templated": false }, "health": { "href": "http://localhost:8080/actuator/health", "templated": false }, "health-path": { "href": "http://localhost:8080/actuator/health/{*path}", "templated": true }, "info": { "href": "http://localhost:8080/actuator/info", "templated": false }, "conditions": { "href": "http://localhost:8080/actuator/conditions", "templated": false }, "shutdown": { "href": "http://localhost:8080/actuator/shutdown", "templated": false }, "configprops": { "href": "http://localhost:8080/actuator/configprops", "templated": false }, "configprops-prefix": { "href": "http://localhost:8080/actuator/configprops/{prefix}", "templated": true }, "env": { "href": "http://localhost:8080/actuator/env", "templated": false }, "env-toMatch": { "href": "http://localhost:8080/actuator/env/{toMatch}", "templated": true }, "loggers": { "href": "http://localhost:8080/actuator/loggers", "templated": false }, "loggers-name": { "href": "http://localhost:8080/actuator/loggers/{name}", "templated": true }, "heapdump": { "href": "http://localhost:8080/actuator/heapdump", "templated": false }, "threaddump": { "href": "http://localhost:8080/actuator/threaddump", "templated": false }, "prometheus": { "href": "http://localhost:8080/actuator/prometheus", "templated": false }, "metrics-requiredMetricName": { "href": "http://localhost:8080/actuator/metrics/{requiredMetricName}", "templated": true }, "metrics": { "href": "http://localhost:8080/actuator/metrics", "templated": false }, "scheduledtasks": { "href": "http://localhost:8080/actuator/scheduledtasks", "templated": false }, "mappings": { "href": "http://localhost:8080/actuator/mappings", "templated": false } } } |
http://192.168.1.172:8080/actuator/prometheus
# HELP jvm_memory_used_bytes The amount of used memory
# TYPE jvm_memory_used_bytes gauge
jvm_memory_used_bytes{area=”heap”,id=”G1 Survivor Space”,} 610528.0
jvm_memory_used_bytes{area=”heap”,id=”G1 Old Gen”,} 1.536768E7
jvm_memory_used_bytes{area=”nonheap”,id=”Metaspace”,} 3.053188E7
jvm_memory_used_bytes{area=”nonheap”,id=”CodeCache”,} 7017856.0
jvm_memory_used_bytes{area=”heap”,id=”G1 Eden Space”,} 1.8874368E7
jvm_memory_used_bytes{area=”nonheap”,id=”Compressed Class Space”,} 4342440.0
# HELP application_ready_time_seconds Time taken (ms) for the application to be ready to service requests
# TYPE application_ready_time_seconds gauge
application_ready_time_seconds{main_application_class=”com.example.MyApplication”,} 1.848
# HELP jvm_info JVM version info
# TYPE jvm_info gauge
jvm_info{runtime=”OpenJDK Runtime Environment”,vendor=”Private Build”,version=”17.0.6+10-Ubuntu-0ubuntu122.04″,} 1.0
# HELP jvm_gc_memory_allocated_bytes_total Incremented for an increase in the size of the (young) heap memory pool after one GC to before the next
# TYPE jvm_gc_memory_allocated_bytes_total counter
jvm_gc_memory_allocated_bytes_total 0.0
# HELP tomcat_sessions_rejected_sessions_total
# TYPE tomcat_sessions_rejected_sessions_total counter
tomcat_sessions_rejected_sessions_total 0.0
# HELP executor_active_threads The approximate number of threads that are actively executing tasks
# TYPE executor_active_threads gauge
executor_active_threads{name=”applicationTaskExecutor”,} 0.0
# HELP process_files_open_files The open file descriptor count
# TYPE process_files_open_files gauge
process_files_open_files 53.0
# HELP system_load_average_1m The sum of the number of runnable entities queued to available processors and the number of runnable entities running on the available processors averaged over a period of time
# TYPE system_load_average_1m gauge
system_load_average_1m 0.14697265625
# HELP application_started_time_seconds Time taken (ms) to start the application
# TYPE application_started_time_seconds gauge
application_started_time_seconds{main_application_class=”com.example.MyApplication”,} 1.812
# HELP disk_total_bytes Total space for path
# TYPE disk_total_bytes gauge
disk_total_bytes{path=”/home/n/spring/work01/.”,} 5.5836598272E10
# HELP process_cpu_usage The “recent cpu usage” for the Java Virtual Machine process
# TYPE process_cpu_usage gauge
process_cpu_usage 0.0
# HELP jvm_threads_live_threads The current number of live threads including both daemon and non-daemon threads
# TYPE jvm_threads_live_threads gauge
jvm_threads_live_threads 21.0
# HELP jvm_memory_usage_after_gc_percent The percentage of long-lived heap pool used after the last GC event, in the range [0..1]
# TYPE jvm_memory_usage_after_gc_percent gauge
jvm_memory_usage_after_gc_percent{area=”heap”,pool=”long-lived”,} 0.0
# HELP tomcat_sessions_created_sessions_total
# TYPE tomcat_sessions_created_sessions_total counter
tomcat_sessions_created_sessions_total 0.0
# HELP executor_pool_size_threads The current number of threads in the pool
# TYPE executor_pool_size_threads gauge
executor_pool_size_threads{name=”applicationTaskExecutor”,} 0.0
# HELP jvm_classes_unloaded_classes_total The total number of classes unloaded since the Java virtual machine has started execution
# TYPE jvm_classes_unloaded_classes_total counter
jvm_classes_unloaded_classes_total 0.0
# HELP jvm_gc_live_data_size_bytes Size of long-lived heap memory pool after reclamation
# TYPE jvm_gc_live_data_size_bytes gauge
jvm_gc_live_data_size_bytes 0.0
# HELP jvm_buffer_total_capacity_bytes An estimate of the total capacity of the buffers in this pool
# TYPE jvm_buffer_total_capacity_bytes gauge
jvm_buffer_total_capacity_bytes{id=”mapped – ‘non-volatile memory'”,} 0.0
jvm_buffer_total_capacity_bytes{id=”mapped”,} 0.0
jvm_buffer_total_capacity_bytes{id=”direct”,} 8192.0
# HELP logback_events_total Number of events that made it to the logs
# TYPE logback_events_total counter
logback_events_total{level=”warn”,} 0.0
logback_events_total{level=”debug”,} 11.0
logback_events_total{level=”error”,} 0.0
logback_events_total{level=”trace”,} 0.0
logback_events_total{level=”info”,} 5.0
# HELP tomcat_sessions_expired_sessions_total
# TYPE tomcat_sessions_expired_sessions_total counter
tomcat_sessions_expired_sessions_total 0.0
# HELP jvm_gc_max_data_size_bytes Max size of long-lived heap memory pool
# TYPE jvm_gc_max_data_size_bytes gauge
jvm_gc_max_data_size_bytes 1.251999744E9
# HELP tomcat_sessions_active_current_sessions
# TYPE tomcat_sessions_active_current_sessions gauge
tomcat_sessions_active_current_sessions 0.0
# HELP executor_queue_remaining_tasks The number of additional elements that this queue can ideally accept without blocking
# TYPE executor_queue_remaining_tasks gauge
executor_queue_remaining_tasks{name=”applicationTaskExecutor”,} 2.147483647E9
# HELP executor_queued_tasks The approximate number of tasks that are queued for execution
# TYPE executor_queued_tasks gauge
executor_queued_tasks{name=”applicationTaskExecutor”,} 0.0
# HELP jvm_gc_memory_promoted_bytes_total Count of positive increases in the size of the old generation memory pool before GC to after GC
# TYPE jvm_gc_memory_promoted_bytes_total counter
jvm_gc_memory_promoted_bytes_total 0.0
# HELP jvm_buffer_memory_used_bytes An estimate of the memory that the Java virtual machine is using for this buffer pool
# TYPE jvm_buffer_memory_used_bytes gauge
jvm_buffer_memory_used_bytes{id=”mapped – ‘non-volatile memory'”,} 0.0
jvm_buffer_memory_used_bytes{id=”mapped”,} 0.0
jvm_buffer_memory_used_bytes{id=”direct”,} 8192.0
# HELP system_cpu_usage The “recent cpu usage” of the system the application is running in
# TYPE system_cpu_usage gauge
system_cpu_usage 0.0
# HELP tomcat_sessions_alive_max_seconds
# TYPE tomcat_sessions_alive_max_seconds gauge
tomcat_sessions_alive_max_seconds 0.0
# HELP jvm_threads_peak_threads The peak live thread count since the Java virtual machine started or peak was reset
# TYPE jvm_threads_peak_threads gauge
jvm_threads_peak_threads 21.0
# HELP jvm_threads_states_threads The current number of threads
# TYPE jvm_threads_states_threads gauge
jvm_threads_states_threads{state=”runnable”,} 7.0
jvm_threads_states_threads{state=”blocked”,} 0.0
jvm_threads_states_threads{state=”waiting”,} 11.0
jvm_threads_states_threads{state=”timed-waiting”,} 3.0
jvm_threads_states_threads{state=”new”,} 0.0
jvm_threads_states_threads{state=”terminated”,} 0.0
# HELP jvm_buffer_count_buffers An estimate of the number of buffers in the pool
# TYPE jvm_buffer_count_buffers gauge
jvm_buffer_count_buffers{id=”mapped – ‘non-volatile memory'”,} 0.0
jvm_buffer_count_buffers{id=”mapped”,} 0.0
jvm_buffer_count_buffers{id=”direct”,} 1.0
# HELP tomcat_sessions_active_max_sessions
# TYPE tomcat_sessions_active_max_sessions gauge
tomcat_sessions_active_max_sessions 0.0
# HELP process_files_max_files The maximum file descriptor count
# TYPE process_files_max_files gauge
process_files_max_files 1048576.0
# HELP executor_pool_max_threads The maximum allowed number of threads in the pool
# TYPE executor_pool_max_threads gauge
executor_pool_max_threads{name=”applicationTaskExecutor”,} 2.147483647E9
# HELP system_cpu_count The number of processors available to the Java virtual machine
# TYPE system_cpu_count gauge
system_cpu_count 2.0
# HELP executor_pool_core_threads The core number of threads for the pool
# TYPE executor_pool_core_threads gauge
executor_pool_core_threads{name=”applicationTaskExecutor”,} 8.0
# HELP jvm_gc_overhead_percent An approximation of the percent of CPU time used by GC activities over the last lookback period or since monitoring began, whichever is shorter, in the range [0..1]
# TYPE jvm_gc_overhead_percent gauge
jvm_gc_overhead_percent 0.0
# HELP jvm_threads_daemon_threads The current number of live daemon threads
# TYPE jvm_threads_daemon_threads gauge
jvm_threads_daemon_threads 17.0
# HELP jvm_memory_committed_bytes The amount of memory in bytes that is committed for the Java virtual machine to use
# TYPE jvm_memory_committed_bytes gauge
jvm_memory_committed_bytes{area=”heap”,id=”G1 Survivor Space”,} 1048576.0
jvm_memory_committed_bytes{area=”heap”,id=”G1 Old Gen”,} 2.7262976E7
jvm_memory_committed_bytes{area=”nonheap”,id=”Metaspace”,} 3.11296E7
jvm_memory_committed_bytes{area=”nonheap”,id=”CodeCache”,} 7536640.0
jvm_memory_committed_bytes{area=”heap”,id=”G1 Eden Space”,} 2.4117248E7
jvm_memory_committed_bytes{area=”nonheap”,id=”Compressed Class Space”,} 4587520.0
# HELP http_server_requests_active_seconds_max
# TYPE http_server_requests_active_seconds_max gauge
http_server_requests_active_seconds_max{exception=”none”,method=”GET”,outcome=”SUCCESS”,status=”200″,uri=”UNKNOWN”,} 0.043207552
# HELP http_server_requests_active_seconds
# TYPE http_server_requests_active_seconds summary
http_server_requests_active_seconds_active_count{exception=”none”,method=”GET”,outcome=”SUCCESS”,status=”200″,uri=”UNKNOWN”,} 1.0
http_server_requests_active_seconds_duration_sum{exception=”none”,method=”GET”,outcome=”SUCCESS”,status=”200″,uri=”UNKNOWN”,} 0.043175703
# HELP executor_completed_tasks_total The approximate total number of tasks that have completed execution
# TYPE executor_completed_tasks_total counter
executor_completed_tasks_total{name=”applicationTaskExecutor”,} 0.0
# HELP jvm_memory_max_bytes The maximum amount of memory in bytes that can be used for memory management
# TYPE jvm_memory_max_bytes gauge
jvm_memory_max_bytes{area=”heap”,id=”G1 Survivor Space”,} -1.0
jvm_memory_max_bytes{area=”heap”,id=”G1 Old Gen”,} 1.251999744E9
jvm_memory_max_bytes{area=”nonheap”,id=”Metaspace”,} -1.0
jvm_memory_max_bytes{area=”nonheap”,id=”CodeCache”,} 5.0331648E7
jvm_memory_max_bytes{area=”heap”,id=”G1 Eden Space”,} -1.0
jvm_memory_max_bytes{area=”nonheap”,id=”Compressed Class Space”,} 1.073741824E9
# HELP jvm_compilation_time_ms_total The approximate accumulated elapsed time spent in compilation
# TYPE jvm_compilation_time_ms_total counter
jvm_compilation_time_ms_total{compiler=”HotSpot 64-Bit Tiered Compilers”,} 688.0
# HELP process_start_time_seconds Start time of the process since unix epoch.
# TYPE process_start_time_seconds gauge
process_start_time_seconds 1.679636917197E9
# HELP disk_free_bytes Usable space for path
# TYPE disk_free_bytes gauge
disk_free_bytes{path=”/home/n/spring/work01/.”,} 3.8974779392E10
# HELP jvm_classes_loaded_classes The number of classes that are currently loaded in the Java virtual machine
# TYPE jvm_classes_loaded_classes gauge
jvm_classes_loaded_classes 7578.0
# HELP process_uptime_seconds The uptime of the Java virtual machine
# TYPE process_uptime_seconds gauge
process_uptime_seconds 9.749