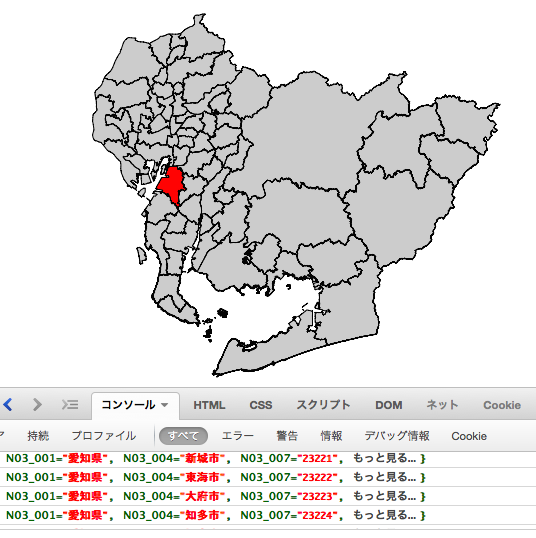
D3.jsが地形データを扱うときにとても便利なので、メモしておききたいと思います。
参考:
D3.jsとOpen Data〜その1地図を描画する
http://qiita.com/sawamur@github/items/ec32237bcbaaba94108d
環境: Mac OSX 10.10.5
使用データ:国土数値情報(愛知県平成27年)
http://nlftp.mlit.go.jp/ksj/gml/datalist/KsjTmplt-N03.html
上記サイトからダウンロードしたファイルをGeoJSONに変換
brew install gdal
ogr2ogr -f GeoJSON aichi.json N03-15_23_150101.shp
同じフォルダに下記プログラムをmap.htmlで保存してブラウザで起動
|
1 2 3 4 5 6 7 8 9 10 11 12 13 14 15 16 17 18 19 20 21 22 23 24 25 26 27 28 29 30 31 32 33 34 35 36 37 38 39 40 41 42 43 44 45 46 47 48 49 |
<html><body> <div id="map"></div> <script src="http://d3js.org/d3.v3.min.js"></script> <script> (function() { var g, width = 700, height = 450; map = d3.select('#map').append('svg') .attr('width', width) .attr('height', height) .append('g'); d3.json("aichi.json", function(json) { var projection, path; projection = d3.geo.mercator() .scale(20000) .center(d3.geo.centroid(json)) .translate([width/2,height/2]); path = d3.geo.path().projection(projection); map.selectAll('path') .data(json.features) .enter() .append('path') .attr('d', path) .attr("fill", function(d){ console.log(d.properties); if(d.properties.N03_004 == '東海市'){ return "rgb(255,0,0)"; } return "hsl(0,0%,80%)"; }) .attr("stroke","hsl(80,100%,0%)" ) .on('mouseover', function(d){ console.log(d.properties.N03_004); d3.select(this).attr("fill", "rgb(0,255,0)"); }) .on('mouseout', function(d){ d3.select(this).attr("fill","hsl(0,0%,80%)"); }) .on('click', function(d) { d3.select(this).attr("fill","rgb(255,0,0)"); }); }); })(); </script> </body></html> |
またjqという便利なJSONデータのクエリーツールを使って特定の地域だけのデータを切り出してみました。
brew install jq
cat aichi.json | jq ‘.features[] | select(.properties.N03_004 == “東海市”)’ > t.json
cat head t.json tail > tokai.jsoncat head
{
“type”: “FeatureCollection”,
“features”: [cat tail
]}
このとき、読むこむjsonをtokai.jsonに変更します。
以下のようにして地域を一覧表示できます。
cat aichi.json | jq ‘.features[].properties.N03_004’
リンク:
以前のD3.js関連の記事: http://crossframe.iiv.jp/tag/d3-js/
パイブとJSONについての記事:http://crossframe.iiv.jp/20140506742/


