
Posted on 2014/06/08, 12:30 AM By admin22
マルコフ連鎖をつかった事例はたくさんありとても興味深い題材です。ここでは、グラフの距離を可視化するツールとして使ってみました。
ケースと結果をわかりやすく説明したものではありませんが、パラメータを変えながらいろいろとテストするためのメモです。
環境: R 3.0.0 / Windows 7
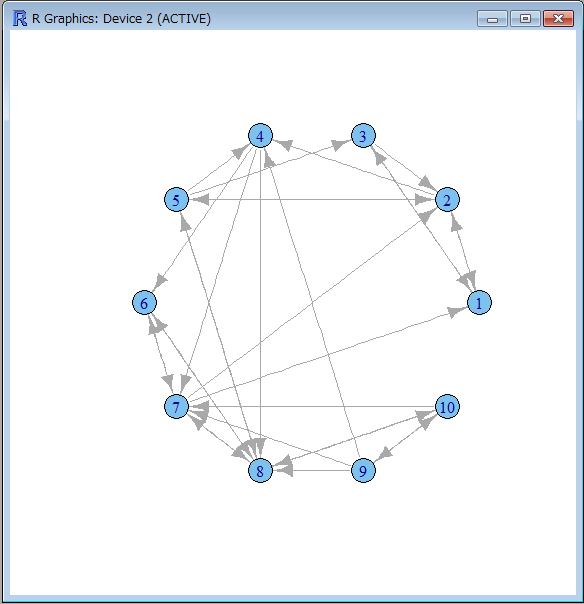
状態遷移行列の内容や掛け合わせる回数を変えながら、グラフの特性を確認できます。
各行の数値は遷移先への確率を表しています。自分自身への遷移は0で、他を合計すると1.0になるようにします。
以下実行コマンド
|
1 2 3 4 5 6 7 8 9 10 11 12 13 14 15 16 17 18 19 20 |
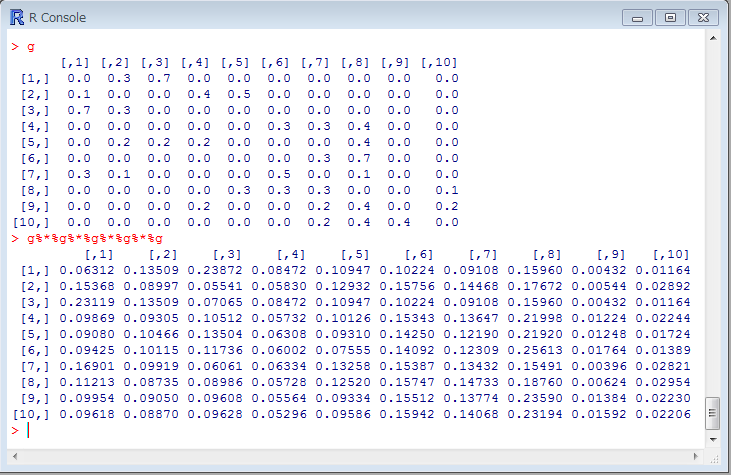
library('igraph') g <- matrix(0,10,10) g[1,] <- c(0, 0.3, 0.7, 0, 0, 0, 0, 0, 0, 0) g[2,] <- c(0.1, 0, 0, 0.4, 0.5, 0, 0, 0, 0, 0) g[3,] <- c(0.7, 0.3, 0, 0, 0, 0, 0, 0, 0, 0) g[4,] <- c(0, 0, 0, 0, 0, 0.3, 0.3, 0.4, 0, 0) g[5,] <- c(0, 0.2, 0.2, 0.2, 0, 0, 0, 0.4, 0, 0) g[6,] <- c(0, 0, 0, 0, 0, 0, 0.3, 0.7, 0, 0) g[7,] <- c(0.3, 0.1, 0, 0, 0, 0.5, 0, 0.1, 0, 0) g[8,] <- c(0, 0, 0, 0, 0.3, 0.3, 0.3, 0, 0, 0.1) g[9,] <- c(0, 0, 0, 0.2, 0, 0, 0.2, 0.4, 0, 0.2) g[10,] <- c(0, 0, 0, 0.0, 0, 0, 0.2, 0.4, 0.4, 0) plot(graph.adjacency(g>0),layout=layout.circle) colors = c("red", "yellow", "blue", "green", "orange", "cyan", "hotpink", "green4", "coral", "azure") barplot(t(g), legend=c('1','2','3','4','5','6','7','8','9','10'), col=colors) barplot(t(g%*%g%*%g%*%g%*%g), legend=c('1','2','3','4','5','6','7','8','9','10'), col=colors) image(g, col=topo.colors(100)) image(g%*%g%*%g%*%g%*%g, col=topo.colors(100)) |
※「%*%」演算子は、行列の積をとるものです。
使用データ
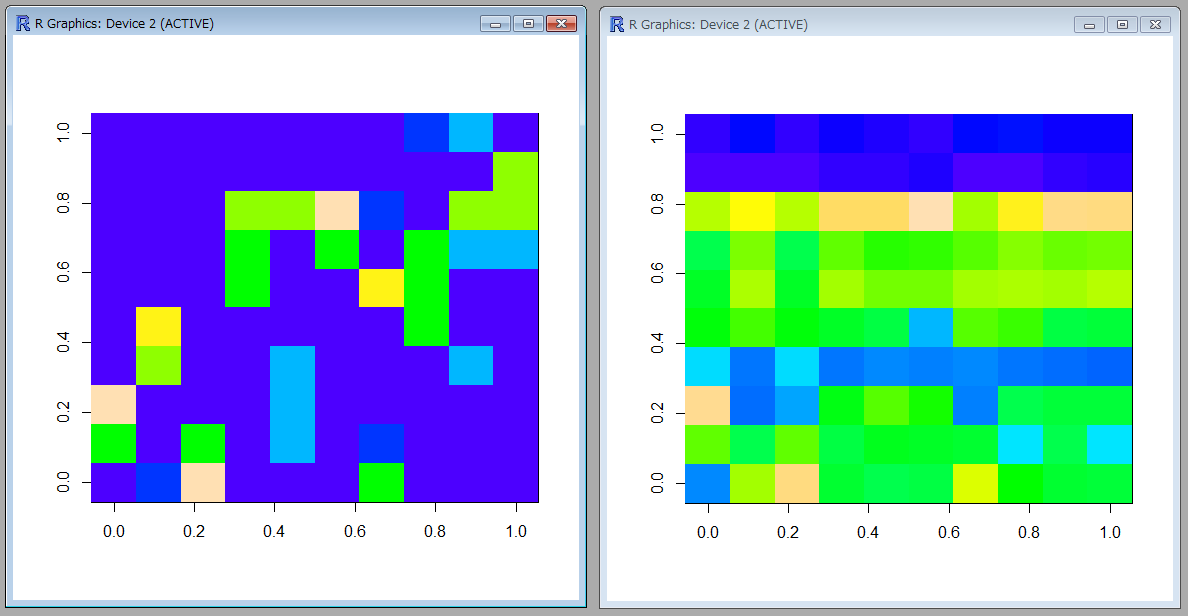
初期状態(左)と5回遷移後(右)の確率を並べました。
上の「使用データ」と見比べるとイメージがしやすいです。

image関数で表示
おもしろいデータ作成になかなか時間がかかりそうです。もっと効率のいい方法をまた考えたいと思います。
Categories: 未分類 タグ: R